Stale Listings Are the Best Deal in Seattle Right Now: What 168,000 King County Sales Show (2026)
- Ryan Palardy,
- November 13, 2026



Yes, and the data is unusually clear about it. In King County in 2026, a house that sat 90 or more days before going pending sold for a median 90% of its original asking price. A house that sold in its first week went for 100% of ask, and more than half of those were bid over list. Compare like with like (same zip, month, size, age and condition) and the stale house still closes 4% to 8% below its week-one value, roughly $40,000 to $60,000 on a $950,000 house. The stale pool is no longer the fixer pool: it is newer than the fresh pool and carries the same condition tags. And two thirds of the sellers who hit day 60 this year pulled their house off the market, so the ones still listed are the ones who decided to sell. Those numbers come from 168,407 King County house listings in our NWMLS database, 2020 through October 2026.
Short on time? Buyers, skip to how we go after a stale listing. Sellers, skip to how not to become one.
For about a decade, every buyer in Seattle learned the same rule: if a house has been sitting, something is wrong with it. In 2021 that rule was correct. Seven out of ten houses sold in their first week, usually over asking. The ones that didn’t were overpriced, or had a sewer line made of Swiss cheese, or both. Skipping them cost you nothing.
That rule is now wrong, and it’s wrong in a way you can measure. I pulled every King County house listing in our NWMLS database since 2020 (168,407 of them) to see what actually happens to a listing after it stops being new. The short version: the stale listing has become the best place to buy a house in this market, and most buyers are still trained to scroll past it.
Want to see the stale listings in your price range with real repair numbers on each one? We’ll pull the houses that have been sitting 30, 60 and 90 days in the neighborhoods you care about and walk them with you in one afternoon. It’s a learning tour, aimed at the part of the market everyone else is ignoring.
In Seattle, a listing starts reading as stale somewhere between day 14 and day 30. By day 60 it is unambiguously stale to every buyer and every agent looking at it. That threshold hasn’t changed much. What changed is how many houses cross it.
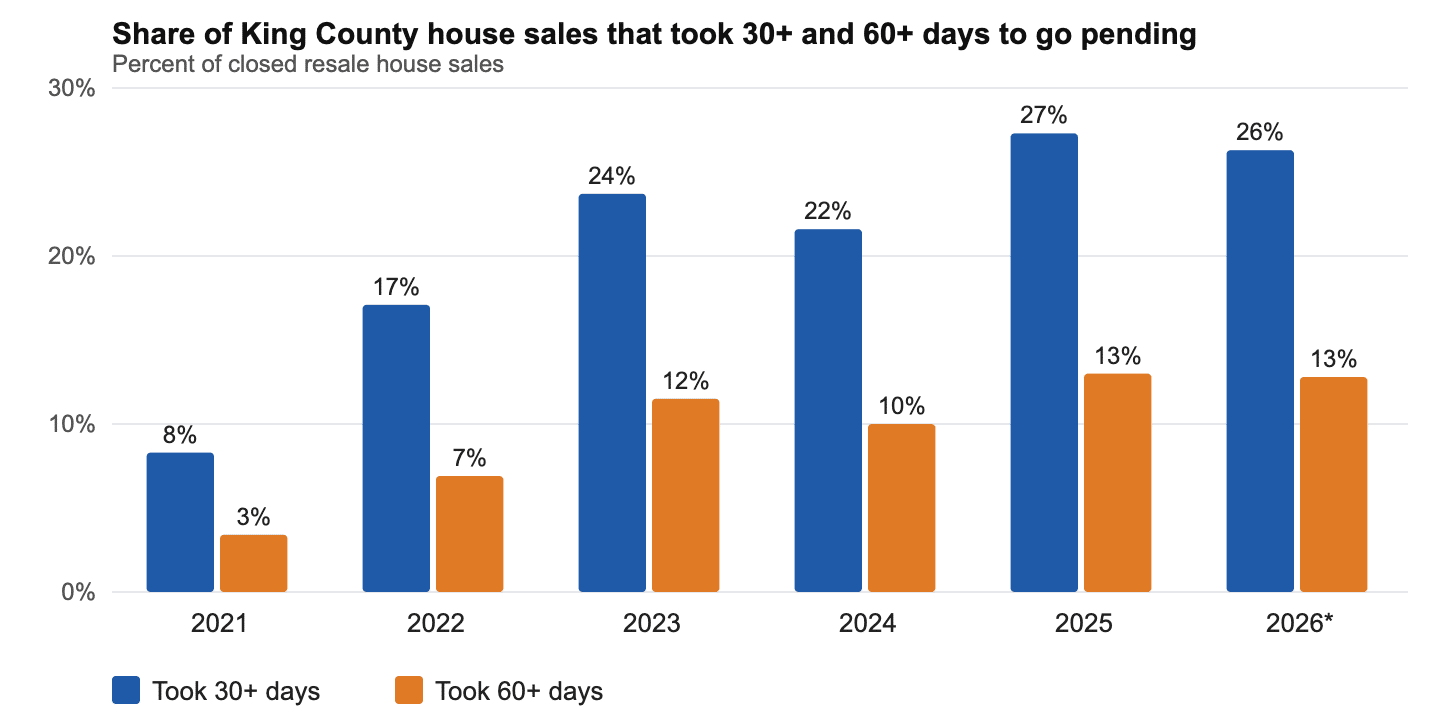
| Year | Houses sold | Median days to pending | Sold in 7 days or less | Took 30+ days | Took 60+ days | Took 90+ days |
|---|---|---|---|---|---|---|
| 2021 | 25,621 | 6 | 71.6% | 8.3% | 3.4% | 1.7% |
| 2022 | 18,941 | 6 | 58.0% | 17.1% | 6.9% | 2.8% |
| 2023 | 14,080 | 7 | 51.7% | 23.7% | 11.5% | 6.3% |
| 2024 | 15,614 | 7 | 54.4% | 21.6% | 10.0% | 4.8% |
| 2025 | 15,429 | 9 | 46.7% | 27.3% | 13.0% | 6.6% |
| 2026 (through early Oct) | 11,591 | 10 | 44.9% | 26.3% | 12.8% | 6.5% |
Source: Get Happy at Home analysis of NWMLS listing data, King County, resale single-family homes and townhomes (new construction excluded), closed sales 2021 through October 7, 2026. “Days” is listing date to pending date.
In 2021, one house in twelve took a month or more to sell. In 2026 it is one in four. A house that has been sitting 60 days is now nearly four times as common among closed sales as it was five years ago. (The 2026 numbers run through early October. The last few weeks always under-count sales, because a sale posts about a month after it goes pending.) If you want the same picture for one neighborhood, we did it for Ballard townhomes last year.
I want to be fair to the old rule, because it was a good rule. In 2021, 71.6% of King County houses went pending within a week, at a median of 109% of asking price, with 87% of them bid over list. If a house was still sitting at day 30 in that market, the buyers had already voted.
Our data says they voted correctly. The 2021 stale pool was older (median year built 1969, versus 1977 for houses that sold fast) and 2.4 times as likely to be tagged a fixer by its own listing agent (12.0% versus 4.9%). The stale houses also launched about 3.5% above what comparable houses were selling for, at the median, with a long tail of sellers who were nowhere near reality.
So the instinct was earned. Overpriced, older, more often a project, and the fresh alternative was going to get bid up anyway, so why bother. That is the frame most buyers (and, frankly, most agents) still carry around. Here is what it misses.
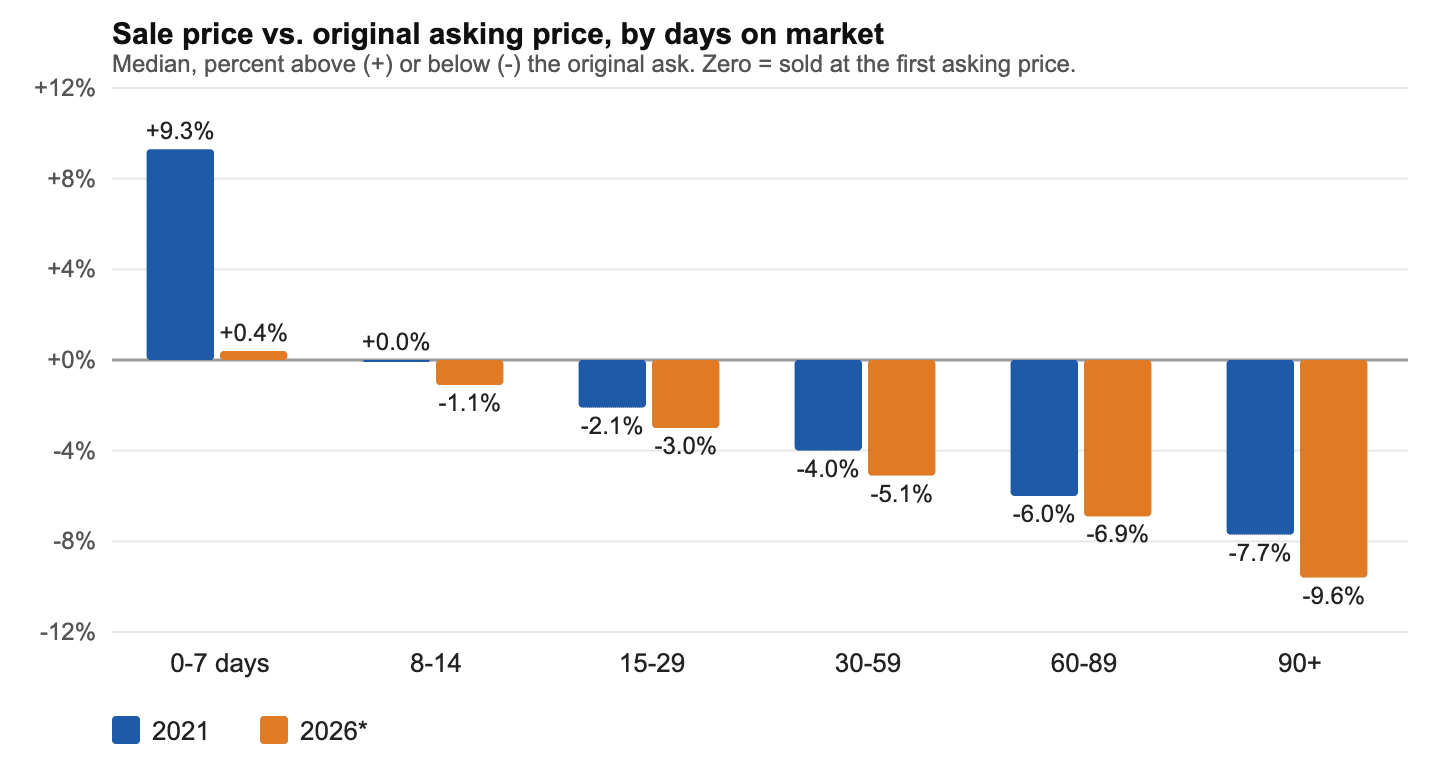
Two numbers matter, and they tell slightly different stories. The first is what the seller gave up relative to their own asking price. The second is what the buyer actually saved relative to a comparable house, which is the number that should drive your offer.
| Days to pending, 2026 | Share of sales | Median sale vs. original ask | Sold over list price | Same-house discount vs. a week-one sale |
|---|---|---|---|---|
| 0 to 7 days | 45% | 100.4% | 55% | reference |
| 8 to 14 days | 14% | 98.9% | 18% | -2.3% |
| 15 to 29 days | 15% | 97.0% | 12% | -3.0% |
| 30 to 59 days | 14% | 94.9% | 11% | -4.6% |
| 60 to 89 days | 6% | 93.1% | 10% | -4.3% |
| 90+ days | 7% | 90.4% | 9% | -5.8% |
Source: Get Happy at Home analysis of NWMLS data, 11,591 King County resale house sales, January 1 to October 7, 2026. “Same-house discount” is a hedonic regression of sale price on finished square feet, lot size, age, bedrooms, bathrooms, home type, listed condition, zip code and sale month; confidence intervals are roughly plus or minus 1.5 points. A matched-comparison check (same zip, quarter, size band and decade built) puts the 90+ day figure between 6% and 8%.
In dollars: the median house that sold after 60 or more days this year closed $78,000 under what the seller first asked. The median house that sold in week one closed $5,000 over. On a $950,000 house, the same-house discount on a 90-day listing works out to somewhere between $40,000 and $60,000 depending on how you measure it. I’d plan an offer around the middle of that range.
The 10 point gap between week-one and 90-day sales is a mix of two things. About 4 to 5 points is the stale seller having asked above market to begin with. That part isn’t your savings; it was never real money. The other 6 to 8 points is the real discount: the house sells for less than a comparable house that launched right. So the sticker gap you see on Zillow is partly the seller’s overreach and mostly your opportunity. (Zillow’s own estimate of the house, for what it’s worth, has a mixed record and knows nothing about why a listing sat.)
One thing I did not expect: the per-house discount is about the same as it was in 2021, when it was 5% to 8% too. What’s different is that there are four times as many of these houses, the fresh alternative no longer costs you 9% over ask, and the pool itself has changed. That’s the next two sections.
This is the part of the argument I find most persuasive, because it is about seller psychology and the data captures it cleanly. Of the King County houses that reached 60 days on market in 2026, 68% were pulled or expired without selling. In 2021 it was 43%.
| Year | Listings that reached 60+ days | Sold | Cancelled | Expired | Gave up |
|---|---|---|---|---|---|
| 2021 | 1,538 | 56.8% | 25.2% | 18.0% | 43.2% |
| 2024 | 3,382 | 46.4% | 32.3% | 21.3% | 53.6% |
| 2026 | 4,627 | 32.1% | 45.1% | 22.8% | 67.9% |
Source: Get Happy at Home analysis of NWMLS data, King County resale houses whose listing reached 60 days before selling, cancelling or expiring. 2026 through October 7.
Among the 2026 sellers who gave up, 57% never cut their price once. Among the stale sellers who did eventually sell, roughly four in five had already cut before the buyer showed up. Put those together and you get a sorting mechanism that works in your favor. The sellers who wouldn’t negotiate have mostly left the market. The sellers still listed at day 60 or 90 are, by selection, the ones who decided they would rather sell than wait.
I can’t see every rejected offer in the data, so some of the non-cutters may have been turning down real offers rather than refusing to move. But the direction is hard to argue with. The stale pool has been pre-filtered for flexibility.
The old assumption was that the stale house had a problem. Here is what the condition data says about the 2026 pool, compared with 2021.
| Year | Group | Houses sold | Median year built | Listed as Very Good, Remodeled or Restored | Listed as Fixer, Fair or Average |
|---|---|---|---|---|---|
| 2021 | Sold within 14 days | 21,341 | 1977 | 38.5% | 4.9% |
| 2021 | Sold after 60+ days | 873 | 1969 | 34.4% | 12.0% |
| 2026 | Sold within 14 days | 6,817 | 1972 | 35.7% | 4.6% |
| 2026 | Sold after 60+ days | 1,481 | 1983 | 35.2% | 5.5% |
Source: Get Happy at Home analysis of NWMLS data, King County resale house sales. Condition is the listing agent’s own entry in the Building Condition field and is blank on about 22% of listings.
In 2026 the stale pool is eleven years newer than the fresh pool, is tagged “Very Good” or “Remodeled” at the same rate, and is tagged a fixer at nearly the same rate. The thing that used to be true about stale listings, that the house itself was the problem, is not true of the 2026 pool as a group. What separates the pools now is price, and the price is already coming down by the time you walk in.
I’ll put the caveat right here rather than at the bottom. “The data no longer flags them as worse” is not the same as “nothing is wrong with them.” The condition field is self-reported, and no regression can see a bad floor plan, a loud street or a basement that smells like 1962. Some fraction of that 4% to 8% discount is almost certainly a real flaw the buyers before you noticed.
This is exactly why the stale-listing play works for buyers who inspect properly and falls apart for buyers who don’t. We walk every one of these with a cost-to-fix number on whatever we find (here’s what a Seattle inspection actually covers). The ones with a real problem get priced for the problem or get skipped.
Days on market changes nothing about the seller’s legal obligations. Washington’s Seller Disclosure Statement (the Form 17, required by RCW 64.06) still has to be delivered, and you still get three business days after receiving it to rescind if you don’t like what’s in it. If a prior buyer backed out after an inspection, ask the listing agent directly whether a previous inspection report exists and what the prior buyer walked over. Sellers aren’t required to hand over a buyer’s inspection report, but a seller who actually wants to close will usually tell you. A material defect the seller now knows about belongs on the Form 17 regardless.
The listing history on the MLS (price changes, the sale that fell through, the earlier cancelled listing) is visible to your agent. Read all of it before you write the offer.
Every stale listing has a cousin: the house that was listed in October, didn’t sell, got pulled before Thanksgiving, and is going to come back in March “when the market is better.” Buyers sometimes ask whether they should wait for those. The data on what happens to them is useful, both for what it says about that seller and for what it says about the one who stayed.
Last winter (November 2025 through January 2026), 1,400 King County house listings were cancelled or expired. About 44% of them came back on the market within one to six months, and 61% of those sold on the relist. The ones that sold came back asking 5% less than their original price and sold in about three weeks at close to the relist ask. Against what they first asked, they netted 92.5%: a median of $90,000 under, about seven months after they first listed. Only 9% of them got their original number.
Finished square footage changed on 2.4% of them, so this was not a renovate-and-relaunch story. It was a price cut with a gap in the middle.
Meanwhile, the sellers whose houses had also sat at least 30 days but who stayed on the market through that same winter, and went pending between December and March, netted 93.5% of their original ask. Same stale house, same winter, same price within a point and a half, and the ones who stayed were done three to four months sooner. In 2020 and 2021, when the market rose 14% to 15% during the wait, pulling and relisting earned about a point. In every flat year since, it earned nothing. The spring premium those sellers were waiting for did not show up in a single flat year.
There’s one more number here that I think every buyer should know. Relisting carries a penalty of its own. A house that comes back after a failed listing sells for 3% to 4% less than a comparable house that sold on its first attempt, in the same month and zip, every year since 2021 (3.7% in 2026). A relist that sells in five days pays it too. And sitting it out on the same listing costs the seller the same 3.8%.
In other words, once a house misses its launch window, the market takes about the same bite whether the seller sits or pulls and comes back. The seller who returns in March has spent the winter learning that lesson. If you liked a house that got pulled in November, there is a decent chance it returns in late winter priced closer to reality, and a decent chance its seller has run out of patience with the process.
Here is the part that surprises people who assume the whole market has gone soft. It hasn’t. In 2026, a house that went pending in its first week still sold for a median 100.4% of asking, and 55% of those sold over list. In the week of October 7 (as far as our data runs) first-week sales were still closing at 100% of ask. The buyers are still here.
They are all standing in the same spot: the new listings. That is where they compete with each other for the house that just hit the market, the one with the fresh seller who hasn’t absorbed a single piece of bad news yet. (If you’re going to be one of those buyers anyway, here’s how we write offers that win without overpaying.)
The stale listing is the opposite of that in every way. No competition, since by definition nobody else bit. A seller who has watched the price cut not work. And a 4% to 8% discount against the house down the street that sold in week one.
If I were buying this winter, my choice would be between fighting four other buyers for the new listing at list price, or being the only offer on the 75-day listing at 92% of ask. I know which one I’d pick. The best house on the market is still worth stretching for. The merely good house two streets over at a real discount is where most people should be shopping.
The mechanics matter, because the whole edge comes from doing the work other buyers skipped.
Read the listing history first. Original price, every cut, any prior listing that cancelled, and whether a sale fell through. A house with one 5% cut at day 30 and a seller who has stayed listed is a different animal from a house that has been relisted three times. Your agent can see all of this on the NWMLS.
Ask the question nobody asks. “Has there been an offer, and what happened to it?” Listing agents on day 70 will tell you more than they would on day 7. The answer tells you whether you’re dealing with a defect, a pricing problem, or a seller who turned down something they now regret.
Anchor your offer to comparable sales, not to the asking price. The asking price on a stale listing was set by a seller who was wrong about the market at least once. Figure out what the week-one version of this house would have sold for, take the same-house discount off that, and start there. A 90-day listing that was overpriced by 5% to begin with and should sell 6% to 8% under its comparable is a 10 to 13 point conversation. That conversation is happening all over King County right now.
Inspect like the house might be stale for a reason. Sewer scope, roof, drainage, wiring, foundation bolting, oil tank. Every time, and especially on the pre-1960 housing stock that makes up so much of Seattle. Most of the 2026 stale pool will come back clean. The ones that don’t get priced for the repair or walked away from. This is where having a construction company in the family (ours is Happy at Home Contracting) turns “the inspector found something” into a number you can put in the negotiation.
Use the calendar. About a third of the houses that closed in January 2026 had sat 60 or more days, the highest share of any month. The houses closing in January are the ones that sat through the holidays with sellers who did not pull them. If you want the stale pool at its deepest and the fresh-listing competition at its thinnest, you are looking at November through January. And if you’ve been waiting for rates to come down before you buy, this is the part of the market where the price does some of the work the rate won’t.
I’d be doing half my clients a disservice if I didn’t flip this around. Everything above is a description of what the market does to a house that misses its first two weeks. The seller’s job in 2026 is not to miss them.
Houses listed in King County from May through July 2026 failed to sell on that attempt 37% to 43% of the time, roughly double the rate for 2024 listings (we wrote about why 4 in 10 listings failed this summer as it was happening). The ones that did sell got 100% of ask at the median. The market is not punishing sellers on price. It is punishing them on whether they sell at all, and the deciding factor is the launch.
Of the 2026 listings that were still unsold on day 14, only 43% ever sold on that listing. In 2021 it was 75%. Every path from there costs about the same 3.5% to 4%: sit, cut, pull, relist, relist fast. None of them gets the launch back.
So price to the market on day one, not to the number you need. Fix the things that would make a buyer’s inspector talk before you list; a pre-listing inspection is cheap insurance against becoming a day-45 price cut.
If you are deciding when to list in 2027, the 2026 data by listing month is blunt. Houses listed January through April had 49% to 52% sell in week one, with 24% to 33% failing. Houses listed May through July had 40% to 43% sell in week one, with 37% to 43% failing. If a lot of sellers who “waited” all list in April, late January and February look even better by comparison.
My advice to a seller who has to move in the next twelve months is to list in February, price at or a hair under the comps, and take the week-one offer. The expensive sale is the slow one.
In Seattle in 2026, usually yes, if you inspect it properly. Houses that sat 90 or more days sold for a median 90% of original ask and 4% to 8% below a comparable week-one sale, and the 2026 stale pool is no more likely to be a fixer than the fast-selling pool. The risk is a flaw the previous buyers found; a full inspection with a sewer scope is how you find out.
In King County a listing starts to read as stale between 14 and 30 days on market, and is unambiguously stale by 60 days. The median 2026 house went pending in 10 days and 45% sold within a week, so anything past two weeks is already slower than most of the market.
In 2026, King County houses that took 90 or more days to go pending sold for a median 90% of their original asking price, versus 100% for houses that sold in week one. Compared with a similar house in the same zip and month that sold in week one, the stale house closes 4% to 8% lower, about $40,000 to $60,000 on a $950,000 house.
In 2021 they skewed toward fixers (12% tagged Fixer or Fair, versus 5% of fast sales). In 2026 the stale pool is newer than the fast-selling pool (median built 1983 versus 1972) and carries the same condition tags. Stale houses do still launch about 4% to 5% above market at the median, so the problem is usually price, not the house. Inspect anyway.
More likely than the seller of a new listing. In 2026, 68% of sellers whose house reached 60 days pulled it rather than sell, and 57% of those never cut price. The sellers still listed at day 60 or 90 are the ones who chose to keep selling, and roughly four in five of the stale sellers who did sell had already cut their price.
Last winter about 44% of pulled King County listings came back within six months, relisted at about 5% below their original ask. The ones that sold netted 92.5% of the first ask, about the same as comparable stale houses that stayed listed through the winter (93.5%), just three to four months later. A relisted house also sells for 3% to 4% less than a comparable first-attempt sale. If you liked it, watch for it in February or March; it will likely be cheaper and the seller more motivated.
Slowing on volume and speed, not on price. King County houses sold at a median 100% of asking in 2026 and week-one sales still drew multiple offers (55% sold over list), but the median days to pending rose from 6 in 2021 to 10, and 26% of sales took a month or more. Buyers who sat out 2024 and 2025 waiting for prices to fall got a slower market instead of a cheaper one, except in the stale pool.
November through January. About a third of houses closing in January 2026 had sat 60 or more days, the highest share of any month, and fresh-listing competition is at its lowest in those months.
If you’ve been scrolling past the 60-day listings, tell us your price range and neighborhoods and we’ll send you the ones worth a second look, with the listing history and our read on each. Then we’ll go walk them. (Still picking an agent? Here’s what to ask any of us.)
Our team keeps a weekly pull of NWMLS listing data for King County going back to 2020 (and in thinner form to 2005). Every listing appears once, at its final status, with its full date and price history. For this article we used 168,407 resale single-family and townhome listings (new construction excluded, condos excluded) from January 2020 through October 7, 2026, and matched relistings to the same property by address and parcel number. “Days” means listing date to pending date for sold homes, and listing date to cancellation or expiration for the ones that didn’t sell.
The same-house figures come from a hedonic regression (sale price controlled for finished square feet, lot, age, bedrooms, bathrooms, home type, listed condition, zip code and sale month) and were cross-checked against a matched-median method; where the two methods differed we report the range. All figures were computed twice from the raw files by independent code. For context on the broader county numbers, the NWMLS monthly market snapshot publishes county-level medians and inventory. King County only. This is market data, not a prediction, and nothing here is a like-for-like discount on any specific house.
Disclaimer: This article is general information, not legal, tax or financial advice. Market figures are King County averages and medians from NWMLS data as of October 2026; individual homes vary. Talk with your own agent, attorney, inspector and lender before making decisions.