Will Bellevue and Kirkland Home Prices Crash? The Tech Job Market Impact.
- Ryan Palardy,
- October 25, 2026



A house in Kirkland or Bellevue is worth about 10% less than it was a year ago. A house in Seattle is worth about what it was a year ago. On a $1.5M house, that 10% is $150,000. I know that’s not what you’ve heard, so let me show my work, and then let’s talk about why.
There are three ways to answer “what’s my house worth now versus last year,” and they don’t agree.
The median sale price is the one in the news: line up every sale, take the middle one. Price per square foot is what agents use to try and compare like-for-like homes of similar size. Both have the same flaw. They depend on what kinds of houses sold. If a bunch of big, remodeled houses happen to sell in Bellevue one year, both numbers jump, and nobody’s house got more valuable. It’s like if you try to take the average height in a room and then take it again after three NBA players walk in. The average goes up, but nobody got taller.
The third way (our way) is to find a house that sold twice and compare its two prices. Same house, no guessing. We did that for every King County house that has sold more than once since 2005: about 6,300 in Kirkland and Bellevue and 17,000 in Seattle, remodels thrown out. Here’s the last 12 months, all three ways:
| Last 12 months vs the 12 before | Kirkland | Bellevue | Seattle |
|---|---|---|---|
| Median price | -8% | -6% | -2% |
| Price per square foot | -8% | -7% | -1% |
| Same house, sold twice | -10% | -9% | -0.2% |
All three agree the Eastside is down. The same-house number says it’s down a bit more than the other two admit.
One thing none of these numbers can see: the houses that didn’t sell. All three measures only count homes that closed. A Kirkland house that sat for 90 days and got pulled because the seller wouldn’t take $1.35M isn’t in the median, isn’t in the price per foot, and isn’t in our same-house number. This spring, 42% of Eastside house listings ended up not selling, an increase from 28% a year earlier. So every figure in this post describes the sales where the seller said yes to today’s market number. The ones who said no are still out there (or off the market), masking some of the downside.
The Eastside housing market runs on tech paychecks. It’s not the only thing, but it’s the big thing, and the last seven years prove it.
From late 2019 to August 2022, King and Snohomish counties added about 42,000 tech jobs, from 261,000 to 303,000. Over the same stretch, Eastside house values rose 74% vs Seattle’s 40%. More paychecks, more people bidding on the same houses equals higher prices. Simple.
Then the paychecks went away and the prices didn’t. By early 2025 the region had lost about 29,000 of those tech jobs, and software jobs specifically (think Microsoft) were down 16% from their peak. You’d expect Eastside prices to fall. They rose instead, 4 to 5% a year through 2024 and into 2025, and pulled further ahead of Seattle while doing it.
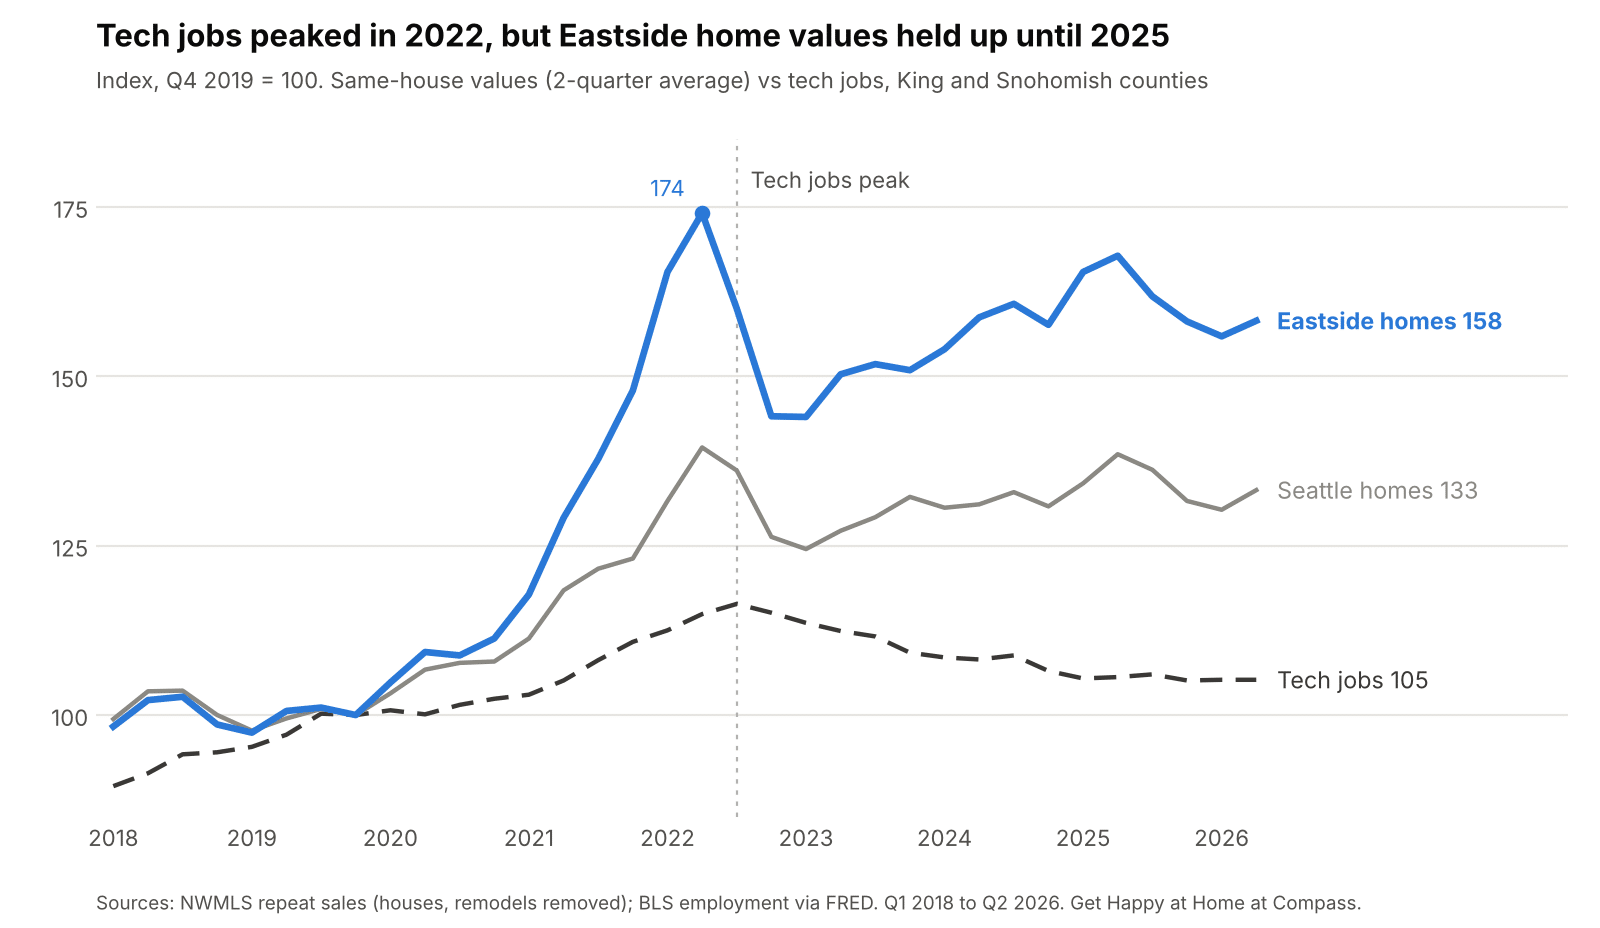
Line chart indexed to Q4 2019 = 100. Tech jobs in King and Snohomish counties peaked at 116 in Q3 2022 and fell to 105 by Q2 2026. Eastside same-house values peaked at 174 in Q2 2022, dropped, climbed back to 168 in Q2 2025, and were at 158 in Q2 2026. Seattle same-house values peaked at 140 in Q2 2022 and were at 133 in Q2 2026.
Sources: NWMLS repeat sales (houses, remodels removed); BLS employment via FRED. Q1 2018 to Q2 2026.
From what we saw in our own deals, three things carried prices through that gap. Stock pay kept tech buyers flush even as headcount shrank; a laid-off engineer with four years of vested shares is still a strong buyer. Almost nothing came up for sale, because anyone with a 3% mortgage stayed put. And everyone, buyers and sellers both, got used to 2022 prices as the new normal. None of that shows up in a jobs report, and none of it lasts forever.
But these things aren’t carrying prices anymore. What’s happening now is the Eastside catching down to a job market that shrank two years ago. The layoffs themselves have mostly slowed: 1,600 fewer tech jobs in June than a year earlier, tiny next to the drops of 2023 and 2024. The price drop is delayed, and the biggest reason isn’t the cuts themselves. It’s something much more intangible than that.
If the job losses have slowed, why is the drop steepest now? Because what moves a buyer isn’t the regional headcount. It’s how safe they feel in their own chair, and right now tech employees around here feel less secure than they have in years. That’s what we hear from clients every week, and it makes sense. A 1% cut at a 50,000-person company is a rounding error on a chart and a very big deal in a group chat, and every new round lands on people who already sat through two years of them. And the AI boogeyman lurches the entire conversation into the realm of the new and unknown. Not a great environment for making major investment and life decisions.
Then there’s immigration. On October 8, the Trump administration suspended Microsoft, Adobe and six other companies from the program their foreign employees use to get green cards. That came on top of a $100,000 fee on every new H-1B visa. Microsoft had about 6,300 H-1B workers approved last year and Amazon 13,300, and Microsoft is the Eastside’s biggest employer. If your green card just went from “in process” to “on hold,” you are not signing a 30-year mortgage this month, whatever the jobs report says.
Here’s what nervous looks like in a transaction. Buyers don’t stretch to the top of their loan approval. They keep the inspection contingency. They offer under asking on a house that would have drawn five offers two years ago, and when the seller says no, they walk, because there’s another home available. None of that is in the employment numbers as of yet. But it is in the prices already.
I think so, but not off a cliff. My bet for the next 12 months is that prices will drop another 2 to 5% on the Eastside, with a flat to +5% upside if mortgage rates ease and the summer drop was partly a blip (that’s what 2023 looked like). The downside scenario is -7 to -10%. This would happen if there’s another big round of tech layoffs, a tech stock correction, worsening mortgage rates, or some combo of the above. For Seattle, I’d guess next years prices will be plus or minus 2% by the same house metric: better, but not great, and less impacted by the tech world than the Eastside numbers.
Why things won’t get way worse: almost nobody has to sell. Bank-owned and short sales are under 1% of Eastside house sales this year. In 2009 to 2011 they were 7 to 13%, and that’s what led to 30% price drops. Today’s sellers who don’t get their number pull the listing instead of panic selling (remember that 42% of homes aren’t selling). That gives you fewer sales and longer times on market, not a crash. It also means the correction is partly hiding in the houses that haven’t sold yet, which is one reason I expect it to run slow rather than stop.
Why not a full reset to match Seattle prices: schools hold the Eastside up. Since 2019 the Eastside has outgrown Seattle by about 13 points, and tech jobs alone don’t justify that anymore. But high suburban prices feed school rankings, and school rankings feed prices, and that loop is baked in. Seattle’s schools are a lot better than their reputation (we wrote about why), but it’s the reputation that sets the gap, and that gap is baked in for the foreseeable future.
Prices will go up this spring. They always do, about 9% from the winter low to the spring high, and that is not the correction ending. A down year on the Eastside looks like a spring that’s 2 to 5% below last spring and a winter 2 to 5% below last winter, with the usual bounce in between. 2024 went exactly like that and ended the year where it started. The question for 2027 is whether spring 2027 beats spring 2026. I don’t think it will.
If you’re buying on the Eastside, you have more room to negotiate than last year’s prices suggest. If you’re selling, price against what your house is actually worth in comparable sales, not the median price and not the price you could have landed in prior years.
Curious what the same house price metric would be for your house? Ask us. It takes me about ten minutes and I enjoy it way more than I should!
All home figures come from our own database of NWMLS King County closed sales, January 2005 through September 2026, houses only (no condos or townhomes). Same-house figures compare pairs of sales of the same house, held at least six months, with observable remodels between sales excluded. Medians and price per finished square foot are resale houses only. Jobs: BLS employment for Seattle-Bellevue-Kent (King and Snohomish counties), information plus professional, scientific and technical services, not seasonally adjusted, through June 2026.
Get Happy at Home is a real estate team at Compass.